Goal : Send Magicxpi ActivityLog to OpenTelemetryCollector and export it to Google Cloud Observability Monitoring
Prerequisites :
- OpenTelemetry (OTEL) Collector installed on your linux machine
- Google account to Access GoogleCloud service
- IMM up and running with correct timezone
1/ Sign in https://console.cloud.google.com/
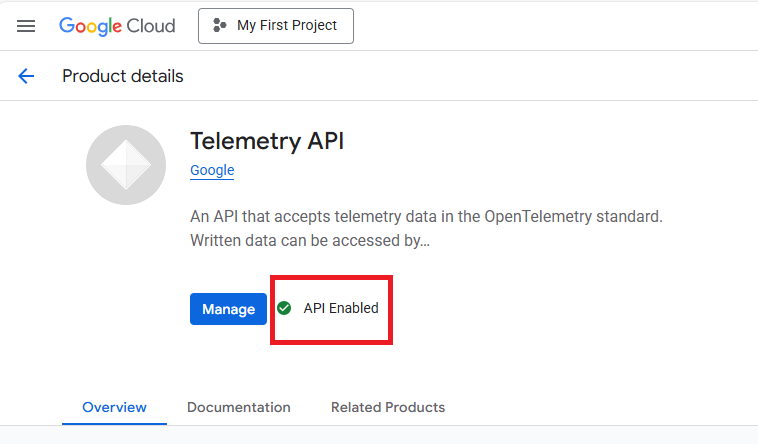
Activate the Open telemetry API
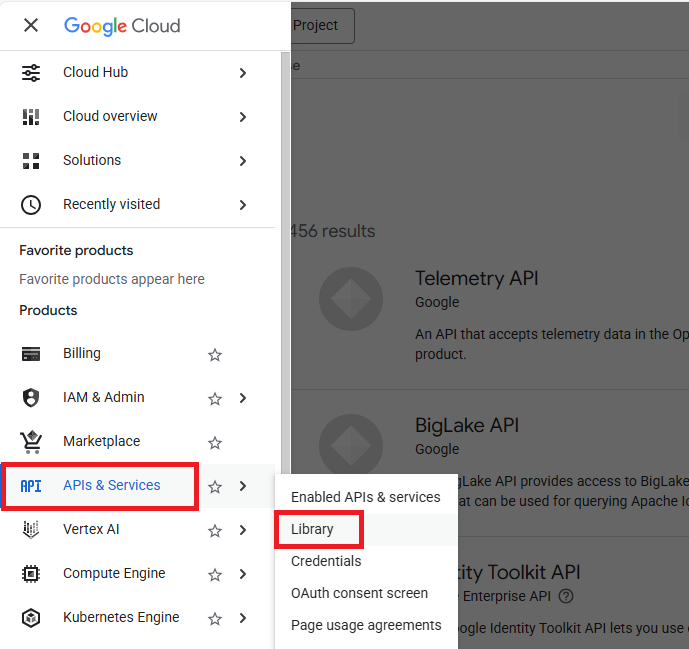
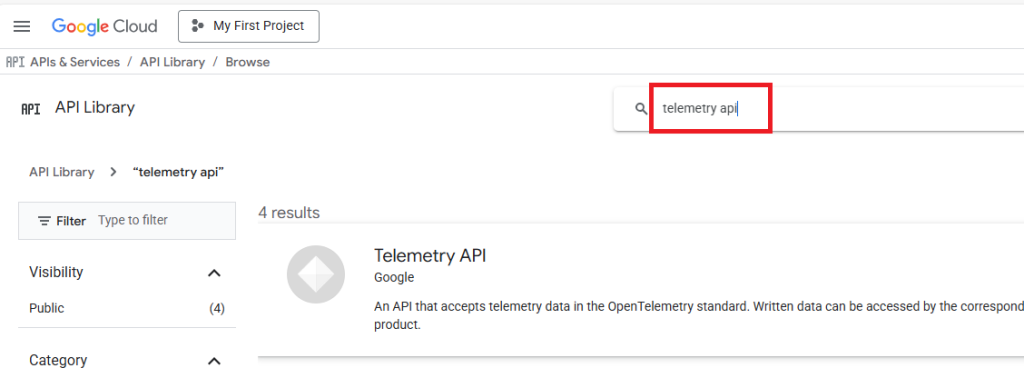
Enable this API
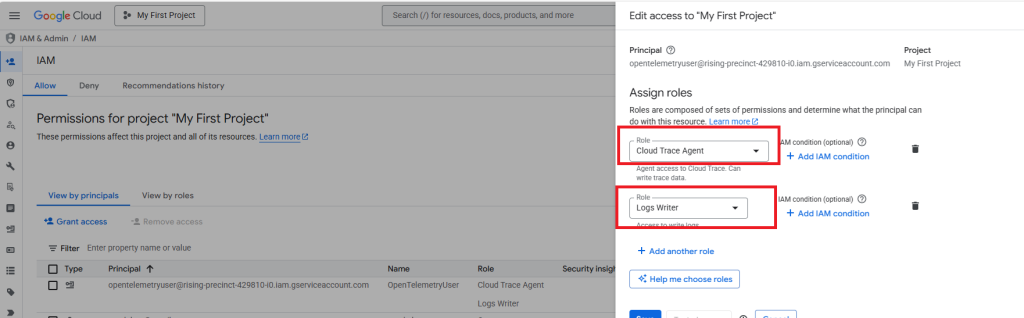
2/ Create a google service account
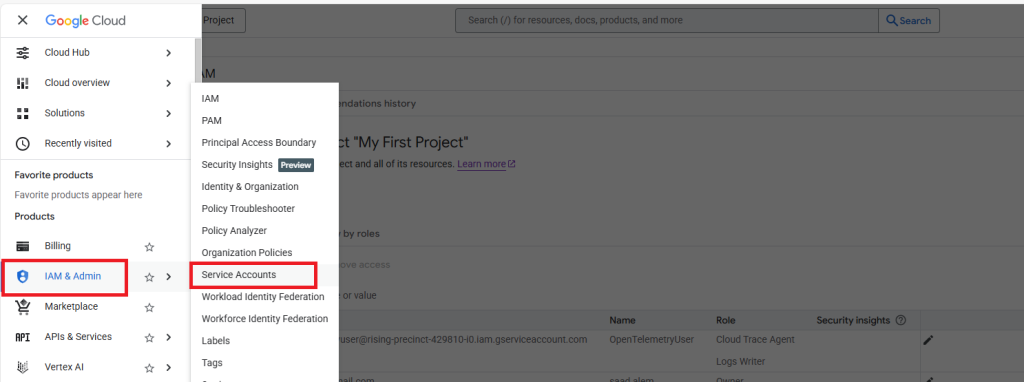
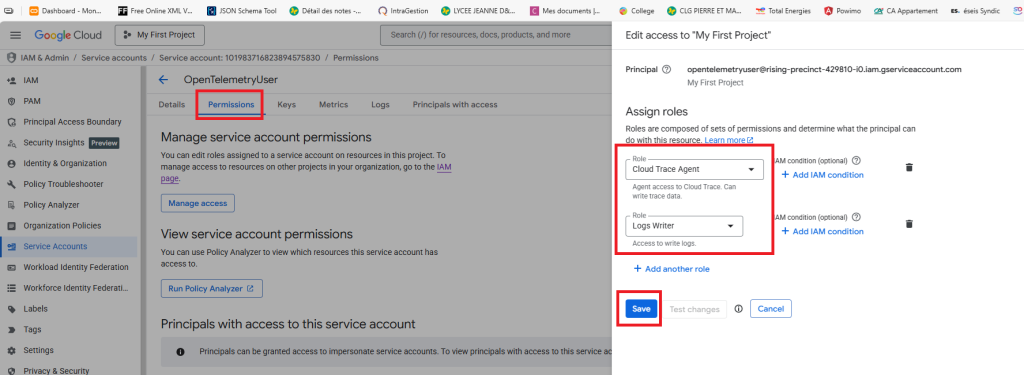
Grant Cloud Trace Agent and Logs Writer roles
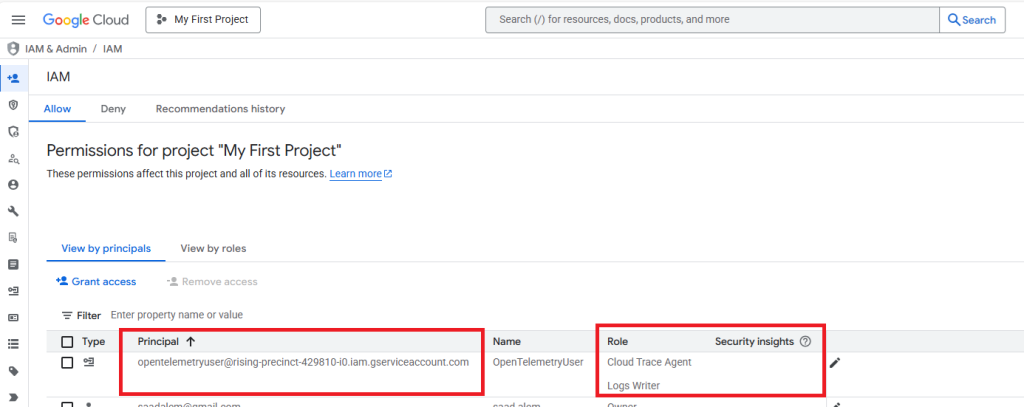
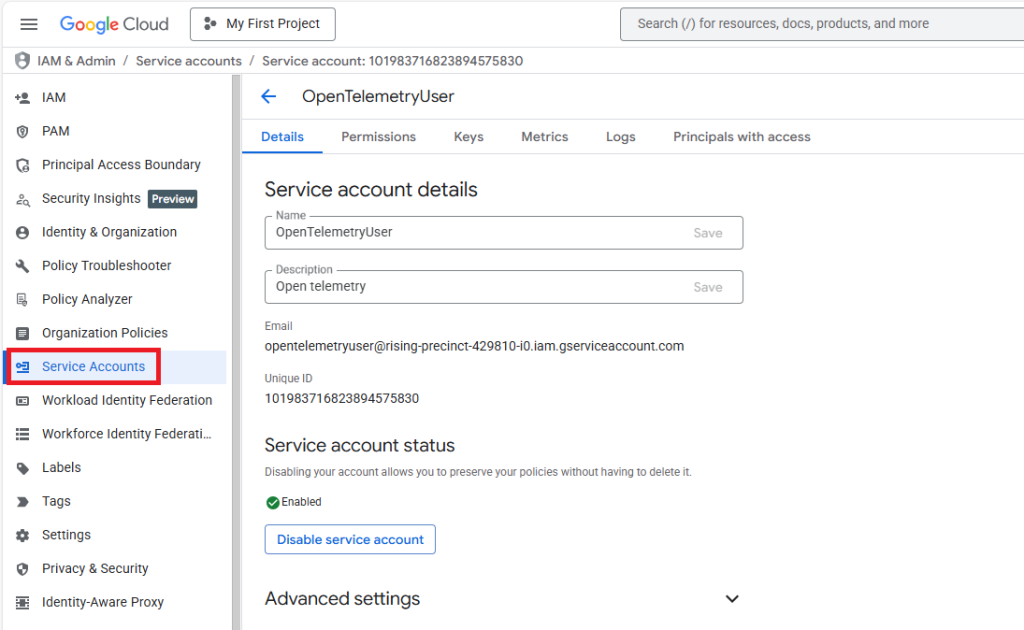
3/ Go back to Service Accounts
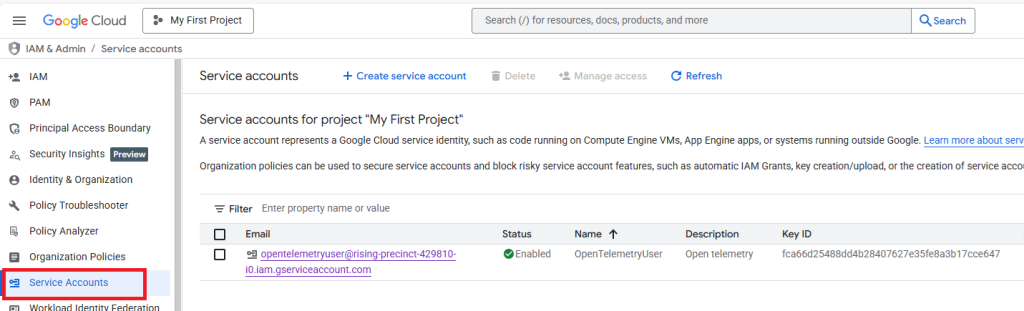
Click on the Email column, then you should see
Then click on Permissions and Manage access and set the 2 previous roles (Logs writer and Cloud Trace Agent) and Save
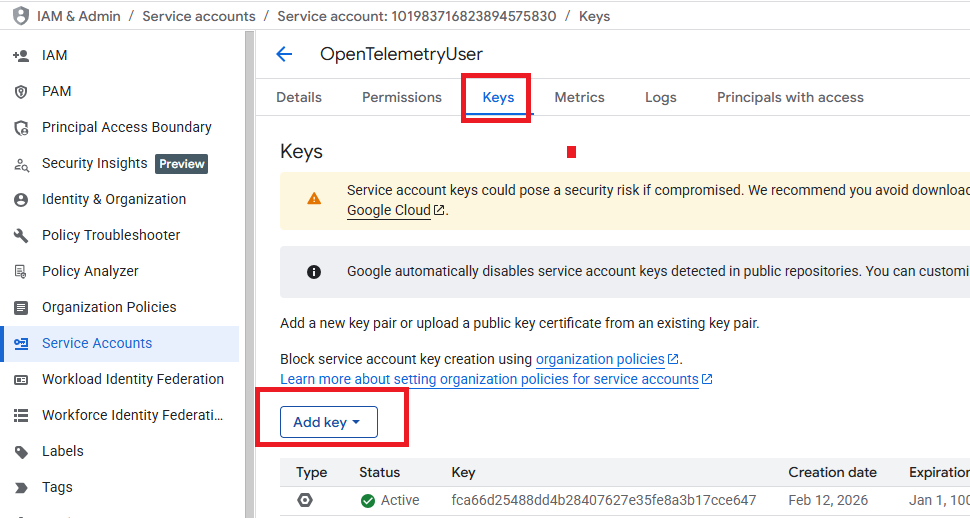
4/ Click on Keys
Click Add a key and Create new key
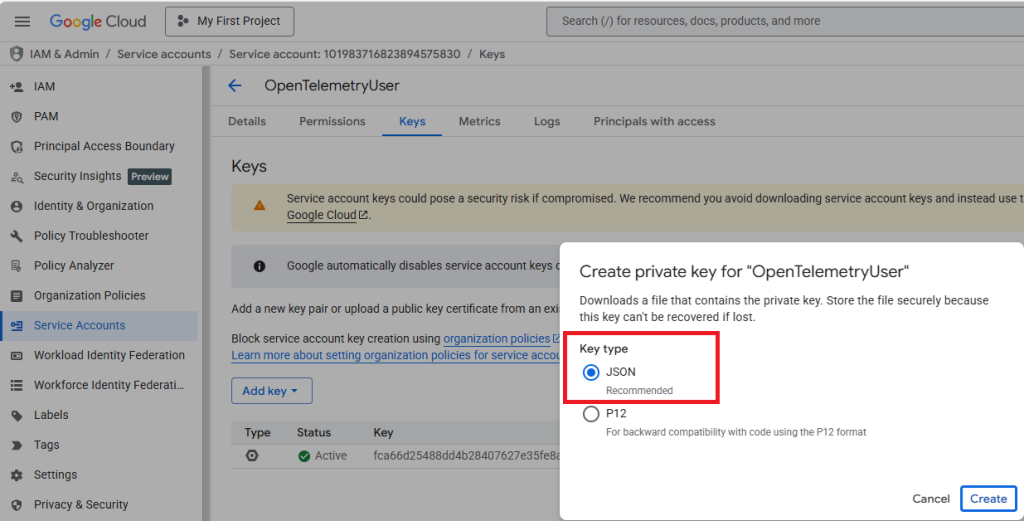
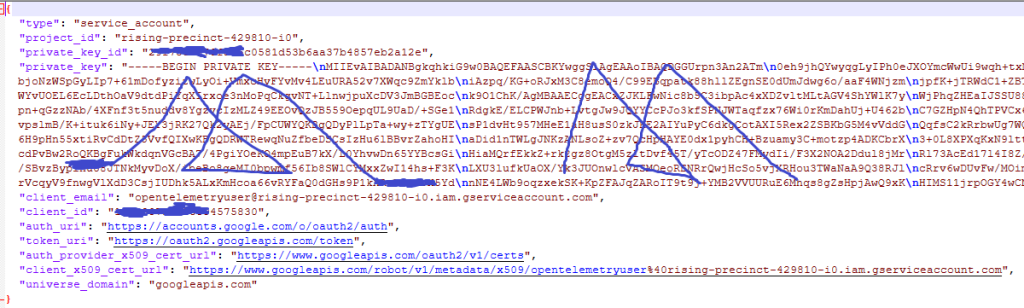
After creation, you will get a json file (keep it in a secure place)
it looks like this
5/ Upload your service account json file in your linux home directory (/in my case /home/ubuntu)
Rename it : service-account-key.json
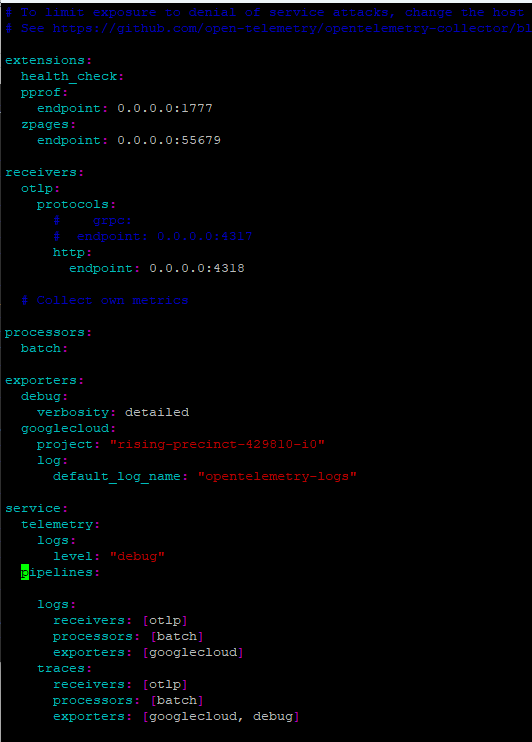
6/ Define your OTEL config file in your home directory
In the exporters section, add googlecloud section and set the google projectid for project and a default log name
In the service =>pipelines=>logs section, set the exporters to googlecloud as well as in the traces section
No need to define OTLPHTTP to export.
sudo vi config.yaml
7/ Start the collector
sudo docker run -p 4317:4317 -p 4318:4318 -v /home/ubuntu/config.yaml:/etc/otelcol-contrib/config.yaml -v /home/ubuntu/service-account-key.json:/etc/otelcol-contrib/service-account-key.json -e GOOGLE_APPLICATION_CREDENTIALS=/etc/otelcol-contrib/service-account-key.json otel/opentelemetry-collector-contrib:0.116.1 –config=/etc/otelcol-contrib/config.yaml
(*) With this command, Google key is automatically mounted in the docker container.
(**) google cloud exporter reads automatically GOOGLE_APPLICATION_CREDENTIALS
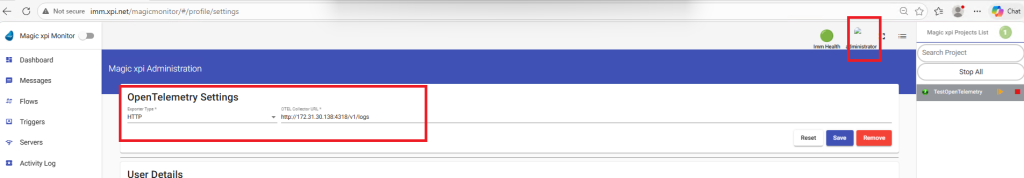
8/ Create a magic xpi project with 2 BAM steps
set the Open Telemetry URL with : http://<IP collector machine>/v1/logs
9/ You should see in the Google Logs Explorer, your magic xpi activity logs
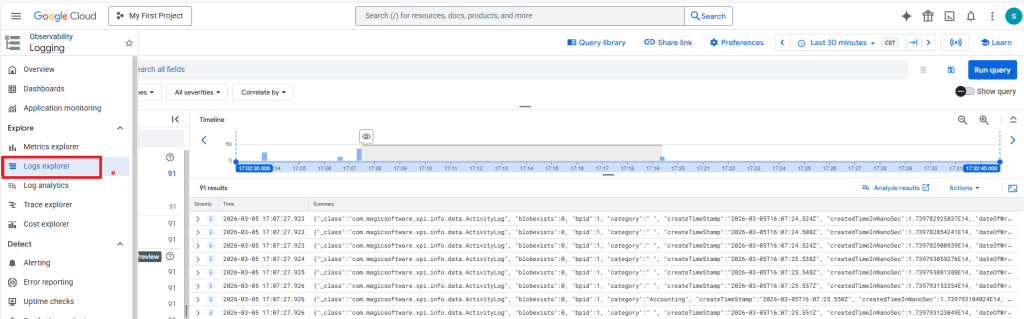
In the query section, you can add : jsonPayload.messagetypeid= »50″ to have only the BAM messages
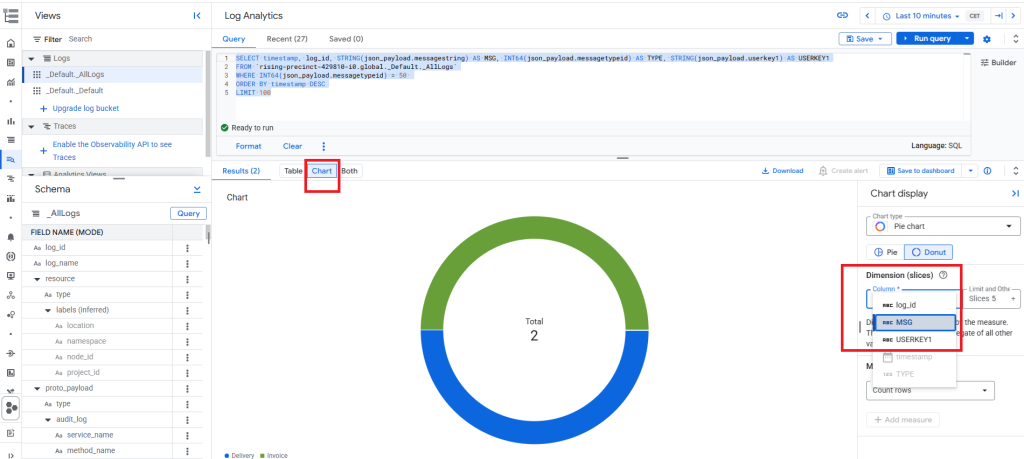
10/ Switch the Google Logs analytics
You can use this kind of requests to parse the json payload
SELECT timestamp, log_id, STRING(json_payload.messagestring) AS MSG, INT64(json_payload.messagetypeid) AS TYPE, STRING(json_payload.userkey1) AS USERKEY1
FROM `rising-precinct-429810-i0.global._Default._AllLogs`
WHERE INT64(json_payload.messagetypeid) = 50
ORDER BY timestamp DESC
LIMIT 100
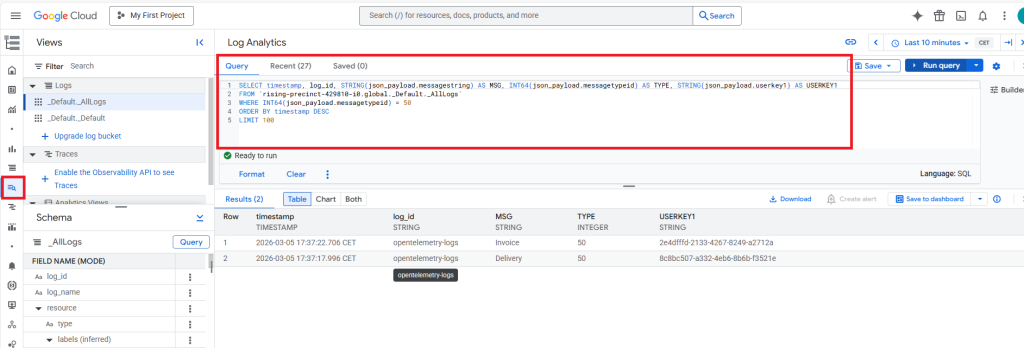
From here you can build your own widget and dashboard by clicking Chart and choose your column dimension