Goal : Send Magicxpi ActivityLog to OpenTelemetryCollector and export it to Amazon Cloud Watch
Prerequisites :
- OpenTelemetry (OTEL) Collector installed on your linux machine
- AWS account to Access AWS service with your AWS_ACCESS_KEY_ID and AWS_SECRET_ACCESS_KEY
- IMM up and running with correct timezone and a Magic xpi project sample
1/ Sign in https://<region>.console.aws.amazon.com/
<region> = eu-west-1 for my example
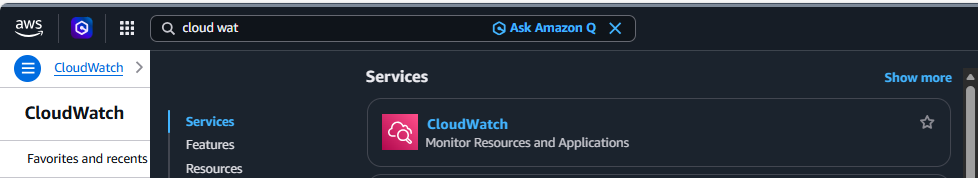
After signing, search for Cloud Watch
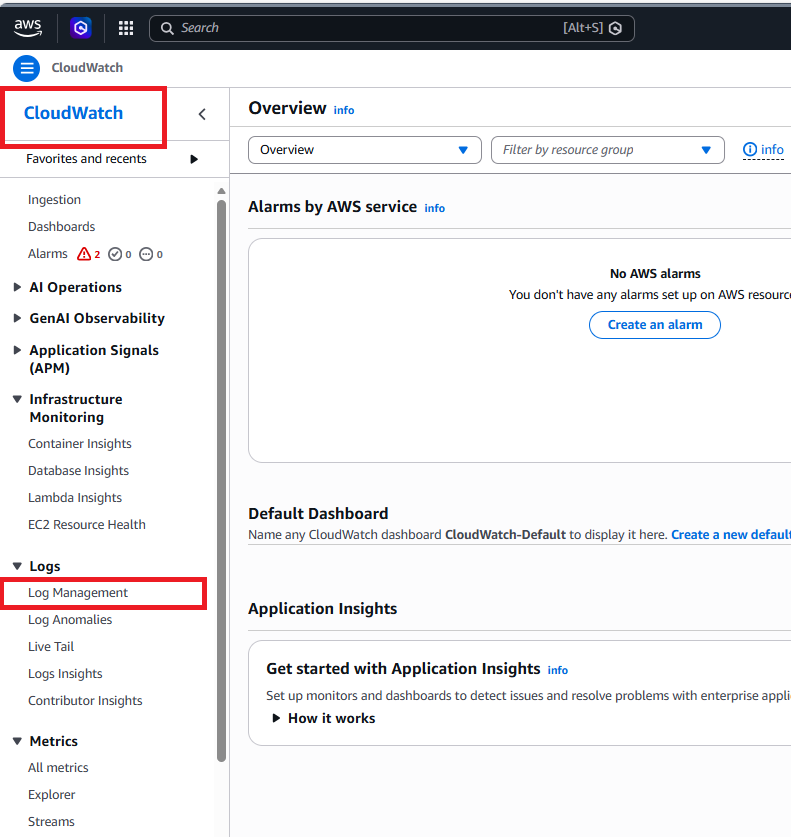
Choose Log Management on the left Menu
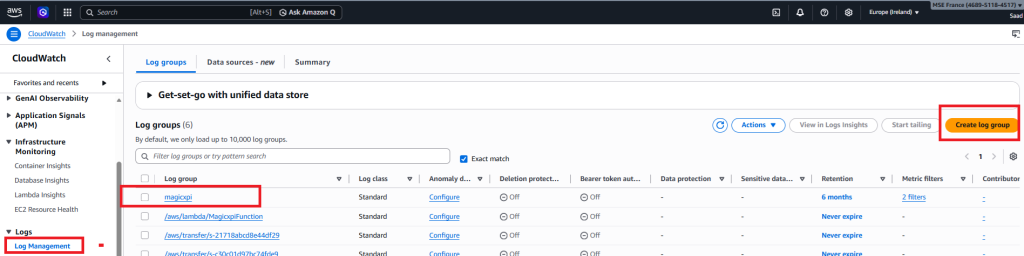
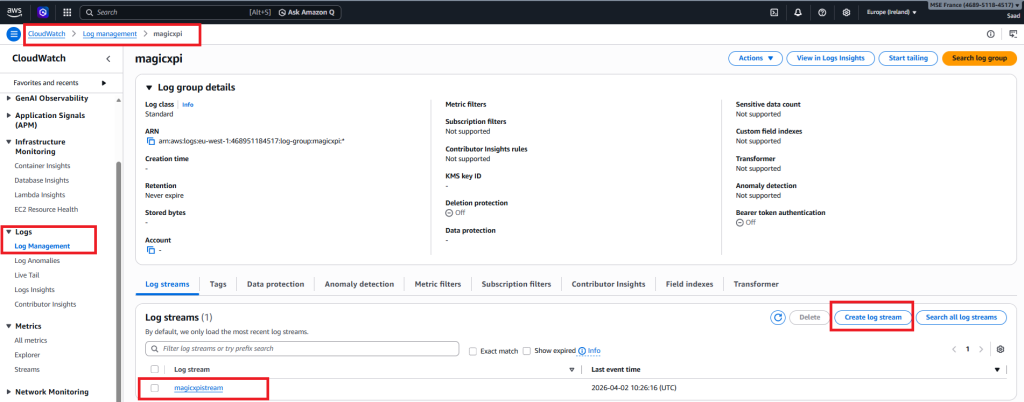
2/ Create a log group (magicxpi) and a log stream(magicxpistream)
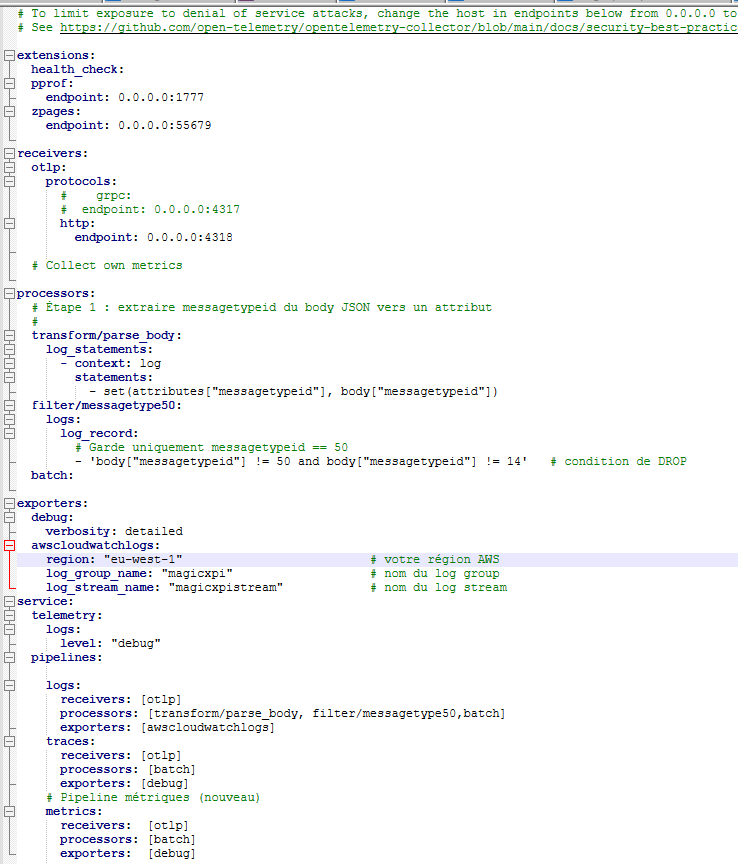
3/ Define your OTEL config file in your home directory on your OTEL collector linux machine
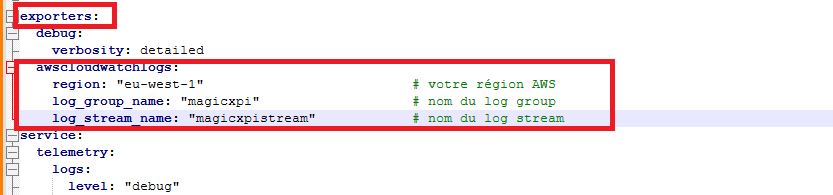
In the exporters section, you have to add the awscloudwatchlogs section with the relevant information.
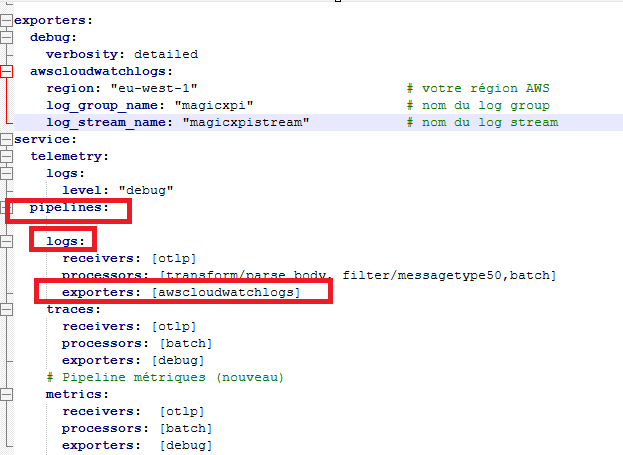
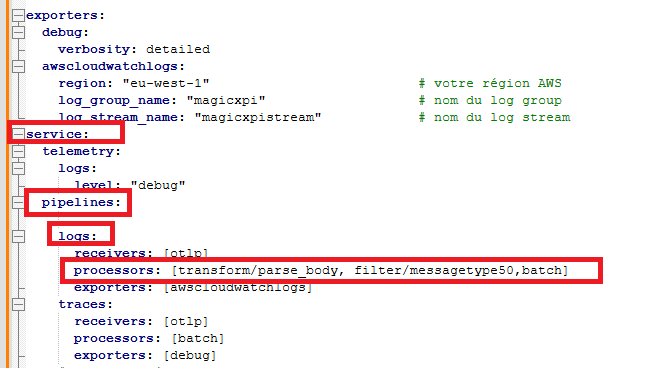
In the service/pipelines/logs section, set the value awscloudwatchlogs in the exporters key
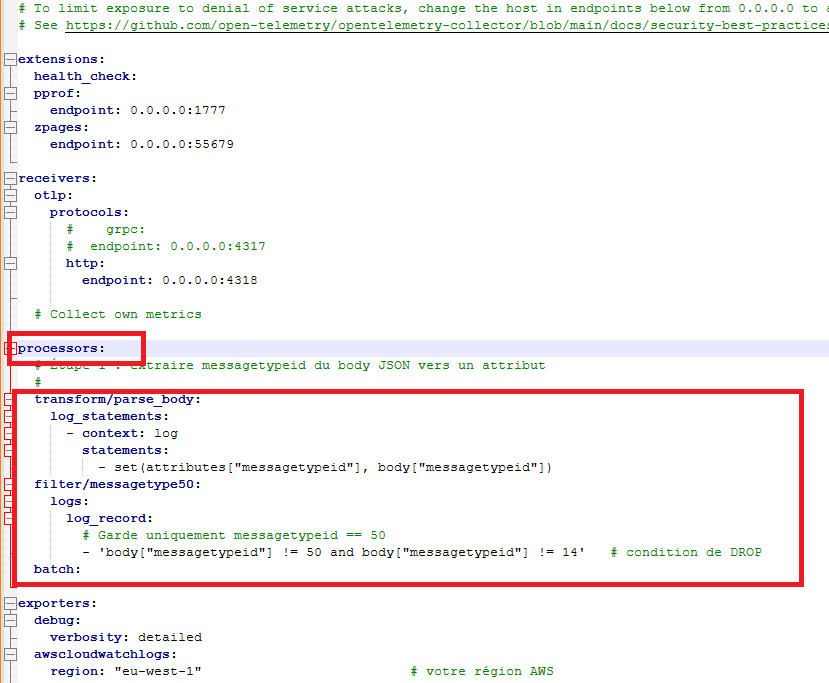
4/ (* optionnal) if you want to export only the Magic xpi BAM (messagetypeid=50) and Magic xpi Messages (messagetypeid=14), you have to fill the processors section in the yaml config file like below.
Then you need to set values for key processors in the service/pipelines/logs
Finally, your OTEL config file should look like below
5/Start the OTEL Collector process
You must set in the docker run command :
- AWS_ACCESS_KEY_ID
- AWS_SECRET_ACCESS_KEY
- AWS_REGION
- otel config file

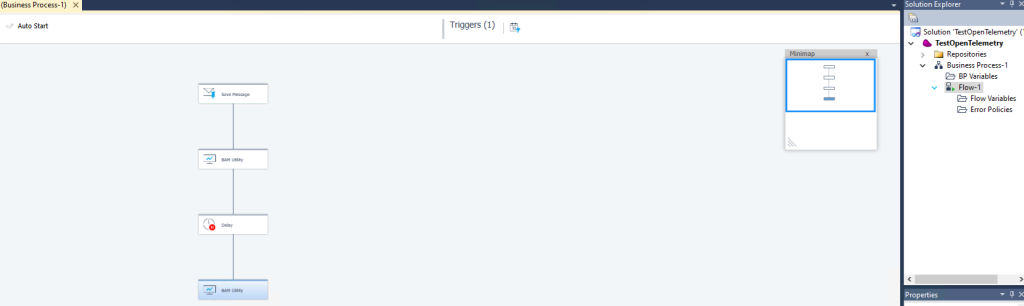
6/ Magic xpi project
I’ve created a simple Magic xpi project that send 2 BAM messages and 1 Save message
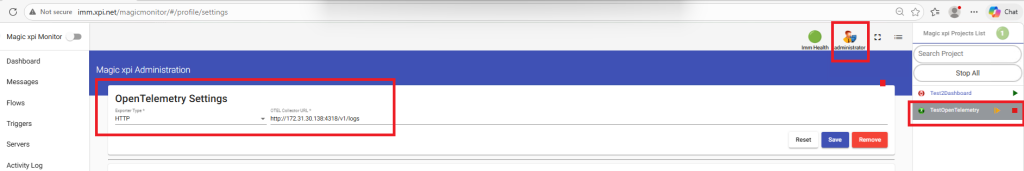
7/ Start the Magic xpi project et set the OTEL URL endpoint in the monitor.
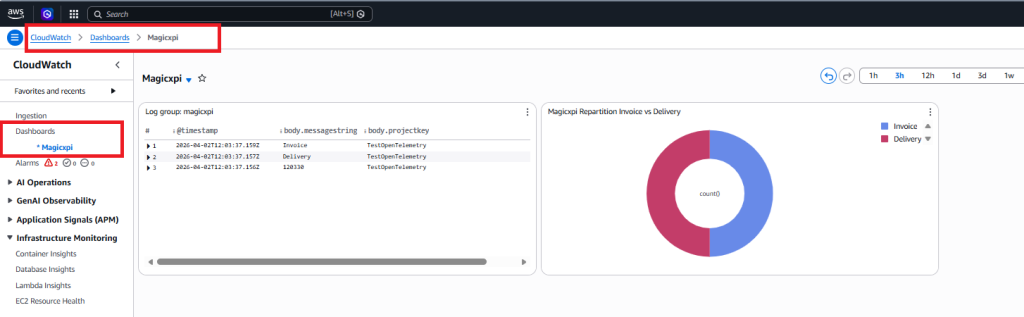
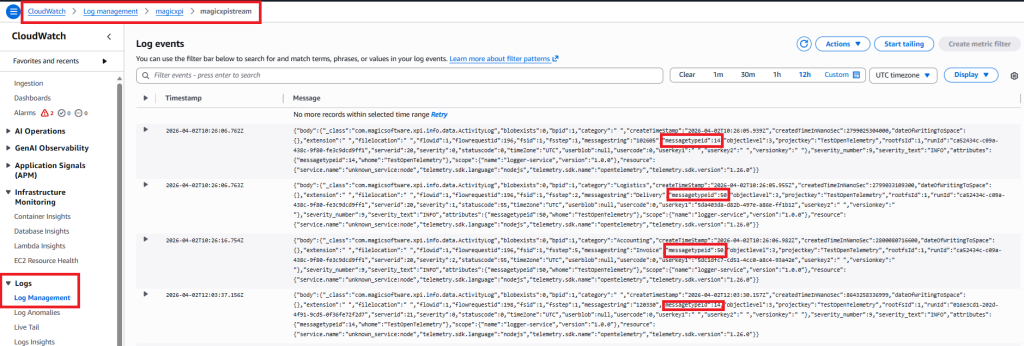
7/ After executing the flow, you should collect the BAM et Save messages in the CloudWatch monitoring
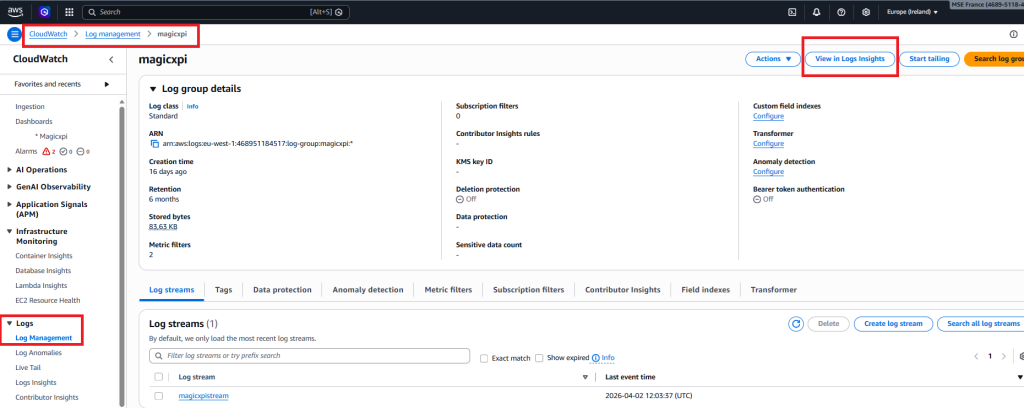
8/To build your dashboard, you can click first in the View In Logs Insights
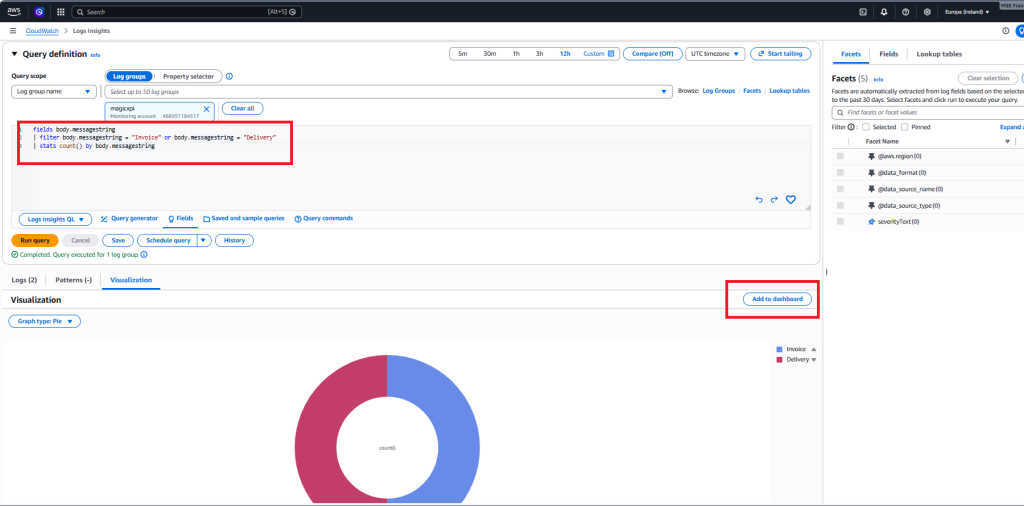
Then you can pass this query :
fields body.messagestring
| filter body.messagestring = « Invoice » or body.messagestring = « Delivery »
| stats count() by body.messagestring
Then choose a pie in the visualization and add to dashboard
9/ Click on Dashboard menu